A moving average smooths jagged candles into a single line that shows the trend. We also look at how to read the “cross” where a short line and a long line meet.
What is a moving average?
For each candle, take the average close of the last few candles and join those values into a line. The 5-day line averages the last 5 candles, the 20-day line the last 20. Day-to-day swings get lost in the average, and the trend shows as a smooth line.
| Line | Behavior |
|---|---|
| Short line (5-day) | Follows recent prices quickly. It turns first when the trend changes, but it also wobbles with every swing. |
| Long line (20-day) | Moves slowly. It shows the big picture but tells you about a change later. |
Reading the trend with a line
- If the price stays above the line and the line is rising, it is commonly read as a rising trend.
- If the price stays below the line and the line is falling, it is commonly read as a falling trend.
- If the line is flat and the price keeps crossing it, the market is often moving sideways.
Golden cross and dead cross
When the short line crosses up through the long line, it is a golden cross; when it crosses down through it, a dead cross. They mean recent prices have become stronger (or weaker) than the bigger trend, so a golden cross is commonly read as a buy signal and a dead cross as a sell signal.
Charts by TradingView Lightweight Charts™
60 candles and two moving averages. On candle 20 the 5-day line crosses up through the 20-day line (golden cross, ↑), and on candle 41 it crosses back down (dead cross, ↓). Volume bars are drawn too. Keyboard: ←/→ to move, +/− to zoom, 0 to see the whole chart.
The orange line is the 5-day line and the teal line is the 20-day line. The up arrow (↑) under a candle marks the golden cross, and the down arrow (↓) above a candle marks the dead cross. Drag the chart sideways with a finger or the mouse to move it, and pinch with two fingers to zoom in. With a keyboard, click the chart, then use ←/→ to move and +/− to zoom.
Watch out for
- Crosses are late. Because they are averages, they only appear after the price has already moved quite a bit.
- In a sideways move the two lines tangle and cross again and again, and most of those crosses are false signals. Read them together with the trend from lesson 2.
How it looks in the game
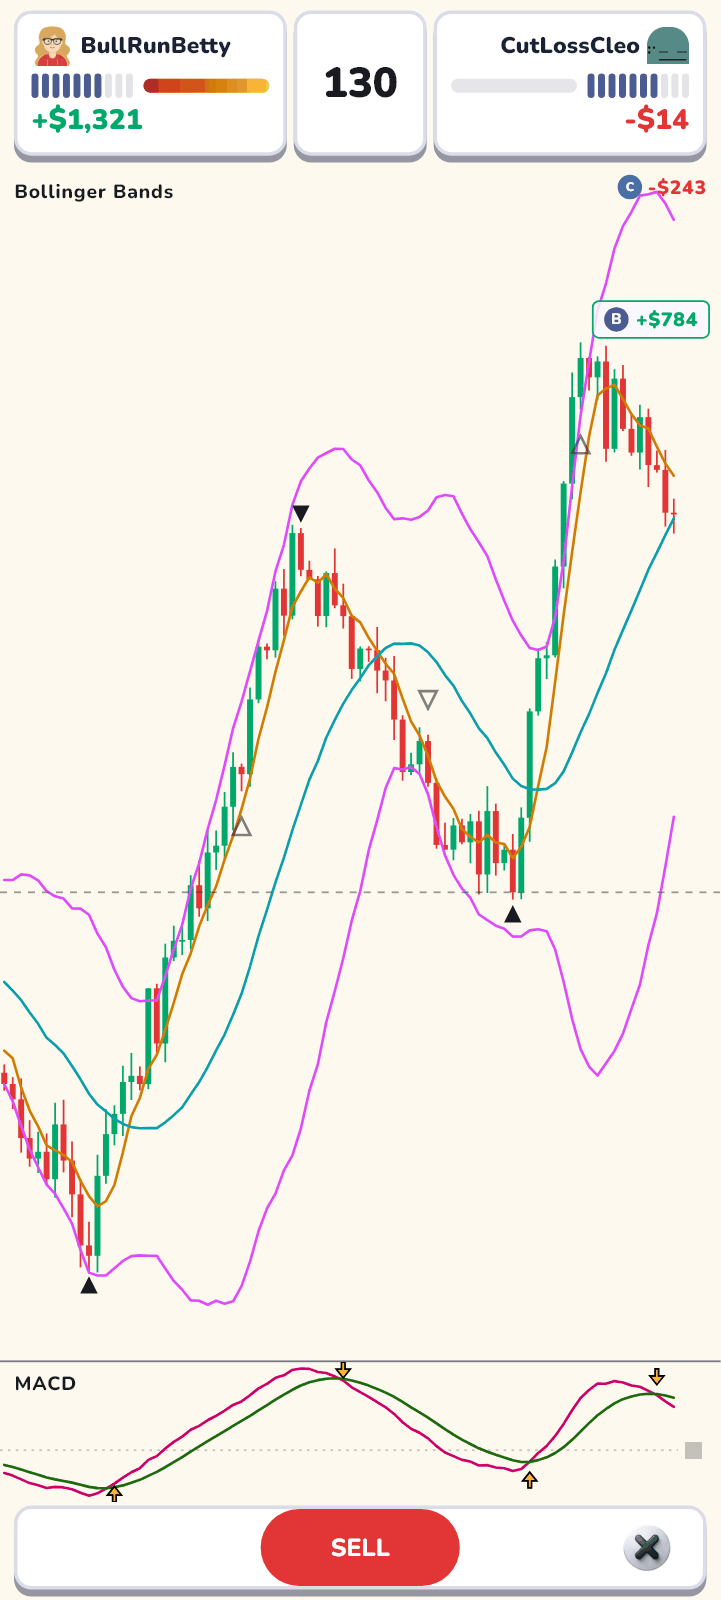
- “Simple Moving Average” is an “Included” weapon, so everyone has it. The setup you start with already has the 5-day and 20-day lines, so the same two lines as in this lesson’s chart are drawn on the match chart.
- Line colors follow the order you equip them. With the starting setup, the 5-day line is orange and the 20-day line is teal.
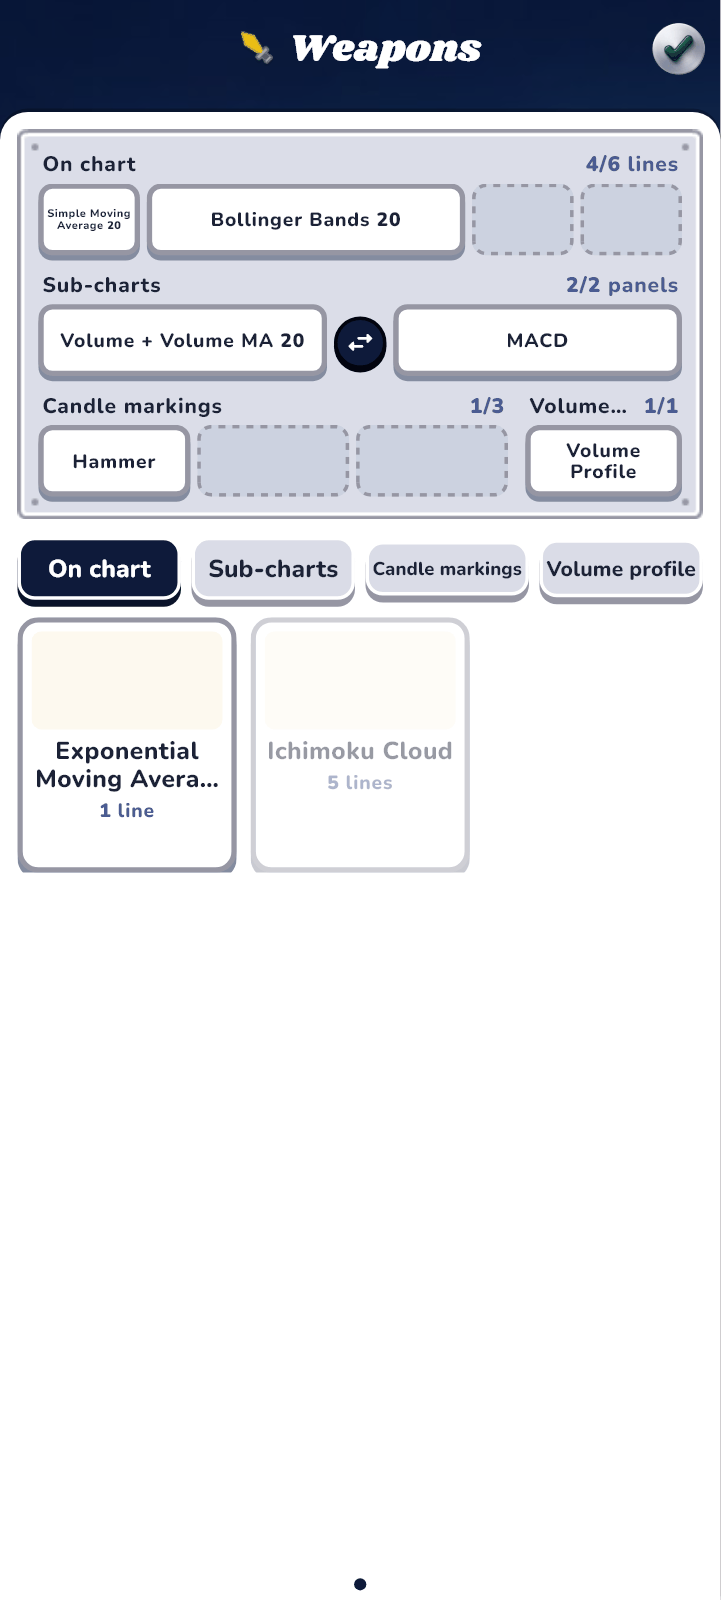
- You can change the period when you equip it on the “Weapons” screen.
- The shop also has “MA Golden Cross” and “MA Dead Cross” weapons that mark the candle where a cross happens (they use a candle marking slot).